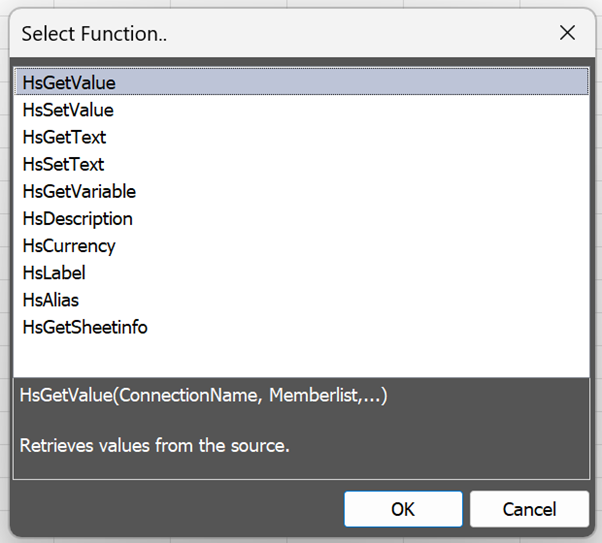
Improved performance for HsGetValue
In Smart View for Office, users should experience improved performance in sheets containing many HsGetValue functions.
Oracle’s Business Benefit: These performance improvements allow you to work with Smart View function sheets more efficiently.
GK’s View: Big welcome change! We noticed severe performance degradation on sheets with many HsGetValue values after a specific Microsoft Excel update. Our fingers are crossed this fixes the problem and even provides better performance.
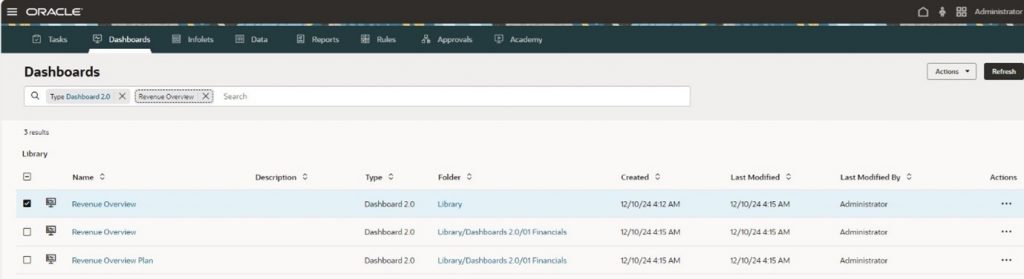
Standardised User Interface for Dashboards, Data Forms, Rules and Documents
The EPM artifact pages now use a new common framework to carry out actions such as filtering, searching, and multi-selecting. Using multi-select, you can now perform global actions such as moving and assigning permissions for multiple artifacts.
Business Benefit: Providing a common framework for EPM Platform artifact pages enables everyone to see the same options, which provides a consistent user experience.
GK’s View:
Good change to help designers review, filter and modify artifacts as well as providing useful information on creation date, modified date and modification user.
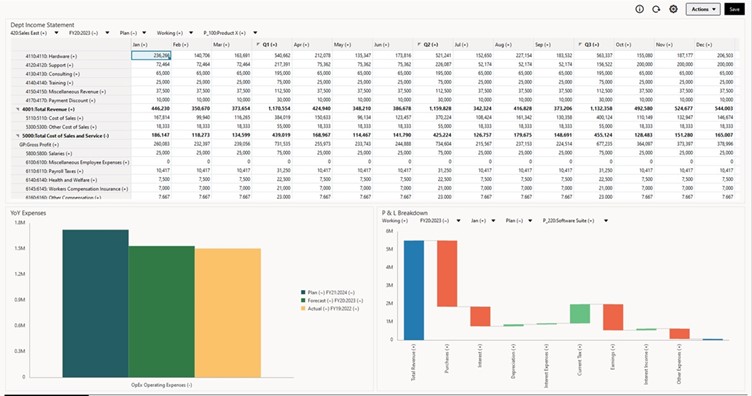
Ability to drill into a Dashboard
You can now create an ad hoc grid directly from a chart within Dashboard 2.0. To drill into an ad hoc grid from a chart in a Dashboard 2.0 dashboard:
- Open a dashboard in Dashboard 2.0.
- Right-click a chart element, and then select Analyze to view the chart intersection in ad hoc.
Business Benefit: Drilling into an ad hoc grid directly from Dashboard 2.0 charts simplifies the user experience.
GK’s View:
You can already drill into the form that drives the chart, this allows the chart user an easy way to drill into an ad hoc which is then further drillable, giving our ‘speed of thought’ analysis.